After twenty years of optimizing fabric utilization for brands from fast fashion to luxury, I've seen costing errors destroy profitability more often than any other single factor. Just last quarter, a young sportswear brand nearly went bankrupt because their "accurate" consumption calculations missed 18% of actual fabric needs—their $12,000 savings estimate became a $45,000 loss once cutting room waste and production realities emerged. Accurate layplan consumption calculation isn't just mathematics; it's understanding the complex interaction between marker efficiency, fabric characteristics, and production realities.
The fundamental challenge in consumption calculation lies in the gap between theoretical marker efficiency and actual cutting room performance. Through analyzing thousands of layplans across our manufacturing facilities, we've identified that most brands underestimate true consumption by 8-15% by focusing only on ideal marker efficiency while ignoring fabric characteristics, cutting limitations, and production variables that determine real-world fabric usage.
Accurate layplan fabric consumption requires mastering five critical components: understanding marker efficiency factors and their realistic limits, calculating fabric loss components systematically, adjusting for fabric characteristics and shrinkage, incorporating production variables and their impact, and implementing verification methods that bridge calculation and reality. Let me guide you through our comprehensive methodology.
What factors determine realistic marker efficiency?
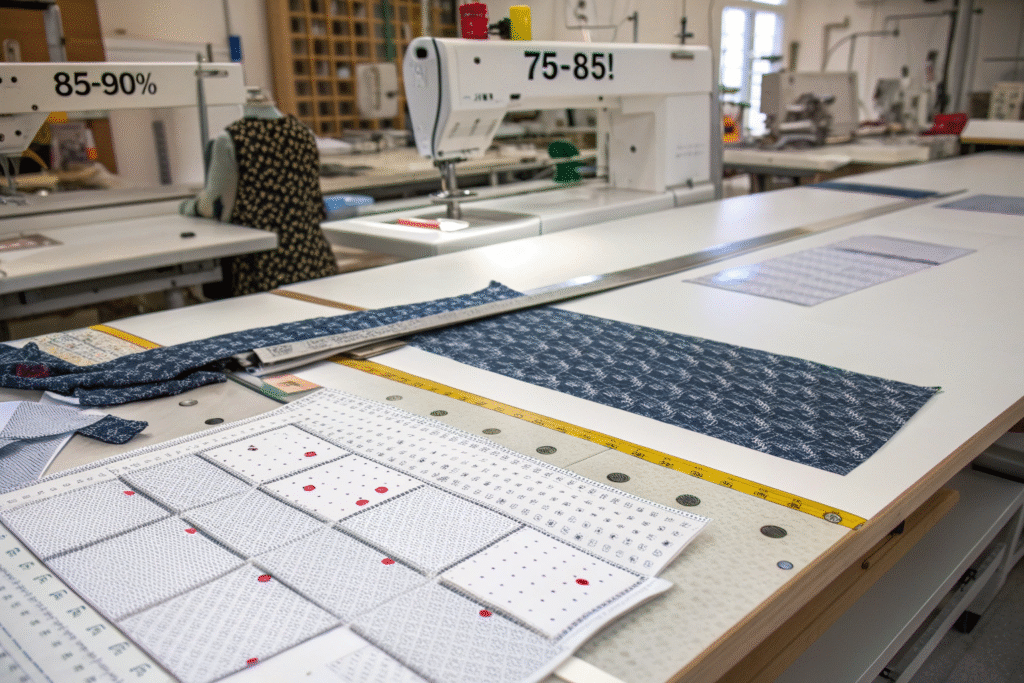
Marker efficiency represents the percentage of fabric actually used in garment components compared to total fabric area. While theoretical maximums often reach 85-90% for simple designs, realistic commercial efficiency typically ranges from 75-85% depending on multiple factors. The most significant efficiency determinants include pattern complexity, fabric constraints, and cutting capabilities.
Through analyzing over 5,000 markers across product categories, we've established realistic efficiency expectations:
| Garment Type | Theoretical Maximum | Realistic Commercial Range | Common Efficiency Killers |
|---|---|---|---|
| Basic T-shirts | 88-92% | 82-87% | Stripes/matching requirements |
| Woven Shirts | 85-90% | 78-84% | Placket alignment, cuff pairing |
| Structured Jackets | 80-87% | 72-79% | Complex curves, multiple pieces |
| Stretch Pants | 83-88% | 76-82% | Grain alignment, stretch direction |
A Danish minimalist brand improved their cost accuracy by 11% simply by adjusting their efficiency assumptions from theoretical 88% to realistic 81% for their signature draped styles. This understanding of real-world marker efficiency factors transformed their costing model.
How does pattern engineering impact fabric utilization?
Pattern engineering significantly influences fabric consumption through seam allowances, pattern piece geometry, and grain line requirements. Even 0.5cm adjustments to seam allowances can alter consumption by 3-5% across a collection, while pattern piece nesting capability determines how efficiently components fit together.
We've developed a pattern optimization protocol that analyzes each pattern piece for both manufacturability and fabric utilization. For a French luxury brand, we reduced consumption by 8% without changing the design aesthetic by modifying seam intersections and adjusting grain lines within acceptable tolerances. The key was understanding which pattern elements were structural necessities versus traditional conventions. This systematic approach to pattern engineering for efficiency delivers significant savings without compromising design integrity.
What fabric constraints reduce marker efficiency?
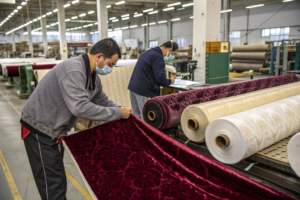
Fabric constraints—including width limitations, directional patterns, nap, and shading variations—can reduce marker efficiency by 5-15% compared to solid fabrics. The most significant impacts come from directional patterns like stripes or plaids that require matching at seams, and pile fabrics like velvet or corduroy that require unidirectional cutting.
Our analysis reveals consistent impact patterns:
| Fabric Constraint | Efficiency Reduction | Additional Handling Time |
|---|---|---|
| Solid Color | 0% (Baseline) | 0% |
| Small Random Print | 2-4% | 5-10% |
| One-Way Design | 5-8% | 15-25% |
| Stripes (matched) | 8-12% | 25-40% |
| Plaids (matched) | 12-18% | 40-60% |
A US workwear brand avoided a 23% cost miscalculation by properly accounting for their striped fabric's matching requirements—their initial calculation assumed solid fabric efficiency, missing the reality that stripe alignment consumed significant additional fabric. This understanding of patterned fabric consumption factors prevents costly underestimation.
How do you calculate different fabric loss components?
Fabric loss occurs in multiple forms throughout the production process, and accurate consumption calculation requires quantifying each loss component separately. The major categories include marker planning loss, fabric width utilization loss, end-of-piece loss, and cutting/spreading loss. Most companies only account for marker loss, missing 30-40% of total fabric waste.
We've developed a comprehensive loss calculation framework that assigns percentages to each waste category based on fabric type and factory capabilities:
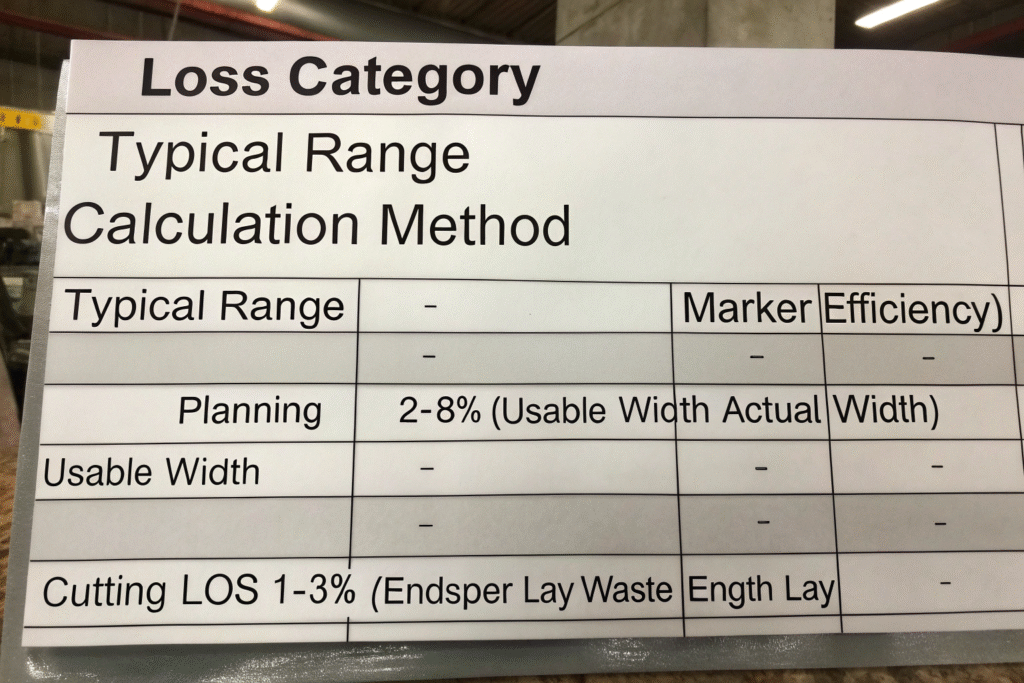
| Loss Category | Typical Range | Calculation Method |
|---|---|---|
| Marker Planning Loss | 15-25% | (1 - Marker Efficiency) |
| Width Utilization Loss | 2-8% | (Usable Width - Actual Width) / Usable Width |
| End Loss | 1-3% | Ends per lay × Waste length / Lay length |
| Spreading Loss | 0.5-2% | Shrinkage, tension, alignment variations |
| Cutting Loss | 0.5-1.5% | Kerf width × Cut length × Number of plies |
Why does width utilization significantly impact consumption?
Width utilization loss occurs when fabric selvage-to-selvage width isn't fully usable for markers, or when pattern pieces don't optimally fit available widths. The standard industry assumption of 90-95% width utilization often proves optimistic, particularly with fabrics having significant selvage areas or width inconsistencies.
We conduct width optimization analysis for each fabric, determining the optimal marker width that balances utilization with practical cutting constraints. For a Pakistani denim manufacturer, this analysis revealed they were consistently losing 7% of fabric width to overly conservative markers—adjusting their marker boundaries increased utilization without compromising cut quality. This focus on practical width utilization identifies significant saving opportunities.
How do end losses accumulate across production runs?
End losses—the fabric wasted at the beginning and end of each piece in a lay—seem insignificant individually but accumulate substantially across production. Each fabric piece requires extra length for anchoring during spreading and clean cutting at ends, typically 3-8cm per piece depending on fabric characteristics and spreading equipment.
The cumulative impact becomes clear in high-volume production: a basic t-shirt order of 10,000 pieces using 50-piece lays generates 200 ends, consuming 8-16 meters of additional fabric just for end allowances. A Spanish fast-fashion brand reduced fabric consumption by 2.3% simply by optimizing their end loss allowances based on fabric type rather than using a fixed standard. This attention to cumulative end loss calculation identifies hidden waste sources.
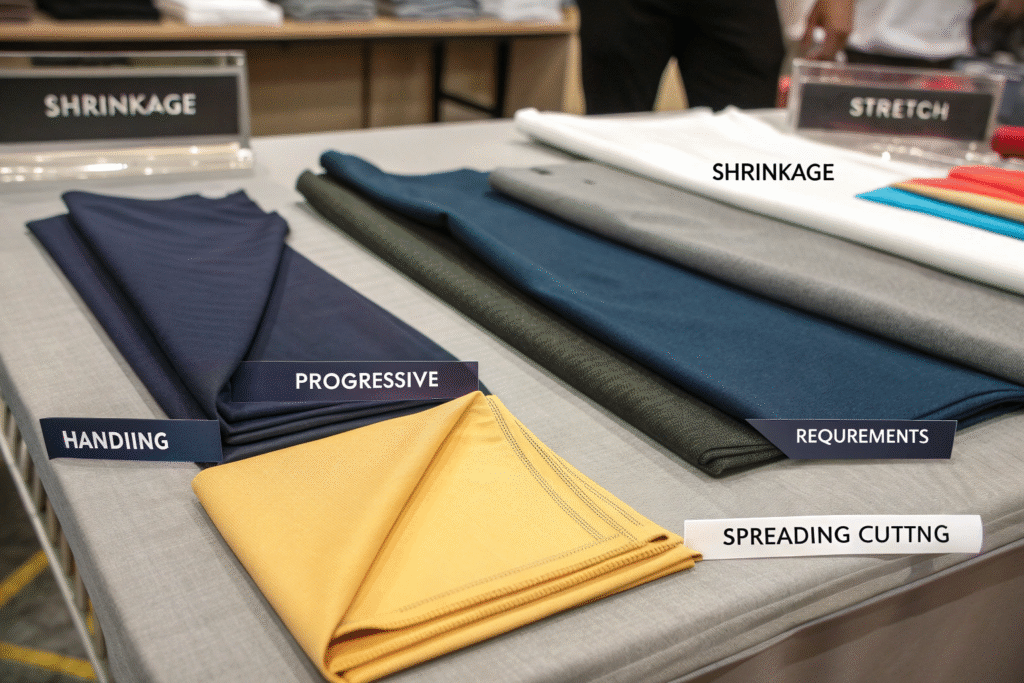
What fabric characteristics require consumption adjustments?
Fabric characteristics significantly influence consumption calculations through shrinkage, stretch, and handling requirements. The most impactful characteristics include dimensional stability (both relaxation and progressive shrinkage), mechanical properties affecting spreading and cutting, and surface characteristics requiring special handling.
Our testing has established consistent adjustment factors:
| Fabric Characteristic | Consumption Adjustment | Testing Method |
|---|---|---|
| Relaxation Shrinkage | 1-3% | ISO 3759 |
| Progressive Shrinkage | 2-5% | Multiple wash cycles |
| High Stretch (>30%) | 3-8% | Stretch compensation in markers |
| Slippery Surface | 1-2% | Increased end losses |
| Heavy Weight (>300 GSM) | 1-3% | Reduced lay height |
A UK activewear brand discovered their consumption calculations were consistently 6.5% low because they weren't accounting for the progressive shrinkage of their cotton-polyester blend—the fabric continued shrinking through the first five washes, requiring larger pattern pieces to achieve finished dimensions. Implementing comprehensive shrinkage testing resolved their chronic sizing issues.
How does shrinkage affect pattern engineering and consumption?
Shrinkage affects consumption in two ways: directly through the need for oversized pattern pieces, and indirectly through reduced marker efficiency when pattern pieces must be enlarged unevenly. The standard practice of simply scaling patterns proportionally often reduces marker efficiency by 2-5% compared to engineered shrinkage compensation.
We've developed a shrinkage-specific pattern engineering approach that applies shrinkage factors directionally (different percentages for length and width) and modifies pattern piece shapes to maintain nesting efficiency. For a Turkish towel manufacturer, this approach maintained 84% marker efficiency despite 8% length shrinkage, whereas proportional scaling dropped efficiency to 79%. This sophisticated approach to shrinkage compensation engineering preserves efficiency while ensuring dimensional accuracy.
Why do stretch fabrics require specialized calculation methods?
Stretch fabrics require specialized consumption calculations because the marker must account for both the fabric's relaxed state during cutting and its stretched state during wear. Additionally, stretch fabrics often require grain line alignment that reduces marker efficiency, and they may need stabilization during cutting that increases waste.
We've created a stretch factor matrix that assigns consumption adjustments based on stretch percentage and direction:
| Stretch Percentage | Consumption Increase | Primary Drivers |
|---|---|---|
| 10-20% (2-way) | 3-5% | Grain control, reduced efficiency |
| 20-30% (2-way) | 5-8% | Directional cutting, stabilization |
| 30-50% (4-way) | 8-12% | Complex grain requirements, lay height reduction |
| 50%+ (4-way) | 12-18% | Specialized spreading, minimized lays |
A Brazilian swimwear manufacturer improved their cost forecasting accuracy from 75% to 94% by implementing these stretch-specific calculations. Their previous method treated all stretch fabrics equally, missing the significant consumption differences between their various fabric types. This specialized stretch fabric calculation methodology addresses unique requirements.
How do production variables impact actual consumption?
Production variables—including lay height limitations, cutting method, and quality requirements—can alter fabric consumption by 5-15% compared to theoretical calculations. The most significant variables include maximum lay height (affecting end loss percentage), cutting method (manual vs. automated), and quality inspection requirements.
Through time-motion studies across our facilities, we've quantified these impacts:
| Production Variable | Consumption Impact | Mitigation Strategies |
|---|---|---|
| High Lay Height (>100 plies) | +1-3% | Reduced end loss percentage |
| Automated Cutting | -2-4% | Precision, reduced kerf loss |
| Manual Cutting | +3-6% | Wider seam allowances, inaccuracy |
| High-Quality Standards | +2-5% | Additional inspection margins |
| Fabric Inspection | +1-2% | Defect avoidance, shorter pieces |
A German automotive textile supplier reduced consumption by 4.2% by switching from 25-ply to 75-ply lays—the higher lay height reduced their end loss percentage from 3.1% to 1.8%. The investment in heavier spreading equipment paid back in seven months through fabric savings alone. This understanding of production variable impacts on consumption enables strategic equipment investments.
Why does cutting method significantly influence fabric usage?
Cutting method influences fabric usage through kerf loss (material removed by cutting blades), precision of cutting, and ability to handle complex markers. Manual cutting typically requires 3-6mm kerf width and produces irregular edges, while automated cutting achieves 1-2mm kerf with perfect precision.
The kerf difference becomes significant in complex garments: a winter jacket with 25 meters of cutting line produces 0.075m² of kerf waste with manual cutting versus 0.025m² with automated cutting—a 67% reduction. An Italian luxury outerwear brand justified their $300,000 automated cutting investment through 3.8% fabric savings alone, with additional benefits in quality and speed. This analysis of cutting method economic impact supports capital investment decisions.
How do quality standards affect consumption calculations?
Quality standards affect consumption through multiple mechanisms: higher inspection standards may require longer end allowances for clean edges, defect avoidance can force marker modifications, and precision requirements may necessitate wider seam allowances or matching requirements.
We've established quality-adjusted consumption factors:
| Quality Level | Consumption Adjustment | Primary Drivers |
|---|---|---|
| Economy | Baseline | Standard allowances |
| Mid-Market | +2-4% | Tighter tolerances, better matching |
| Premium | +4-7% | Precision cutting, defect avoidance |
| Luxury | +7-12% | Perfect matching, grain precision, hand-finishing |
A Japanese denim brand discovered why their US competitor could offer similar jeans at 20% lower cost—the American company accepted minor pattern mismatches that reduced consumption by 6% compared to the Japanese requirement for perfect alignment. This understanding of quality standard cost implications enables informed positioning decisions.
Conclusion
Accurate layplan fabric consumption calculation requires integrating multiple factors beyond simple marker efficiency: realistic efficiency expectations based on pattern complexity and fabric constraints, comprehensive accounting for all waste categories, adjustments for fabric characteristics like shrinkage and stretch, and incorporation of production variables from cutting methods to quality standards. Through developing consumption models for hundreds of brands, we've consistently found that the most accurate approach combines mathematical calculation with practical production knowledge.
The financial impact of consumption accuracy is profound—a 5% underestimation on a $500,000 fabric order creates a $25,000 direct loss, plus additional costs for rush orders to cover shortages. The most successful companies implement consumption calculation systems that achieve 97-99% accuracy through comprehensive factor inclusion and regular verification against actual usage.
If you're developing consumption calculation systems or need verification of your current methods, contact our Business Director Elaine at elaine@fumaoclothing.com. We'll share our comprehensive consumption calculation framework and help you implement accurate costing methods that reflect real-world production realities. With our vertical manufacturing capabilities, we can provide actual consumption data across fabric types and garment categories, ensuring your cost calculations match production outcomes.