You have been burned before. You approved a gold-stamped lab dip that looked immaculate, only to receive 8,000 yards of fabric where the shade drifted noticeably from roll to roll. The mill’s "quality control" was a bored teenager with a flashlight glancing at fabric racing by at 40 meters per minute. When you complained, they pointed to a meaningless AQL 4.0 certificate and offered you a 3% discount on your next order—which you will absolutely never place. The real sting isn’t the wasted cash; it’s standing in your own cutting room, watching your production manager shake his head as he marks 15% of the yardage as B-grade, knowing your entire seasonal margin just evaporated into deadstock. You need to know, before you commit a single dollar, whether Shanghai Fumao’s quality control is real engineering discipline or just another "trust us" story from a sales rep who has never set foot on a weaving floor. Let me show you exactly how strict we are, line by line, machine by machine, gate by gate.
Our QC system across our five production lines—weaving, dyeing, printing, coating, and finishing—is built on a single principle that I enforce with almost paranoid intensity: you cannot inspect quality into fabric at the end of the line. You must build it in at every state change. Each of our five lines operates with its own dedicated QC gate, its own calibrated instrumentation, and its own pass/fail authority that can stop production without asking permission from the production manager. The weaving gate inspector can halt the entire rapier line if she detects a recurring warp streak. The dyeing gate chemist can quarantine a batch if the spectrophotometer reads a Delta E above 0.8. The coating gate technician can reject a laminate if the bond strength falls below 15 Newtons per 5 centimeters. These are not paper authorities; they are exercised weekly, and they cost us real money in delayed shipments and scrapped batches. But they cost far less than shipping defective fabric to a customer who will never return. Let me walk you through each line’s specific standards, the machines that enforce them, and the real failures we caught before they reached a single cutting table.
Weaving QC: How We Catch Defects Before The First Pick
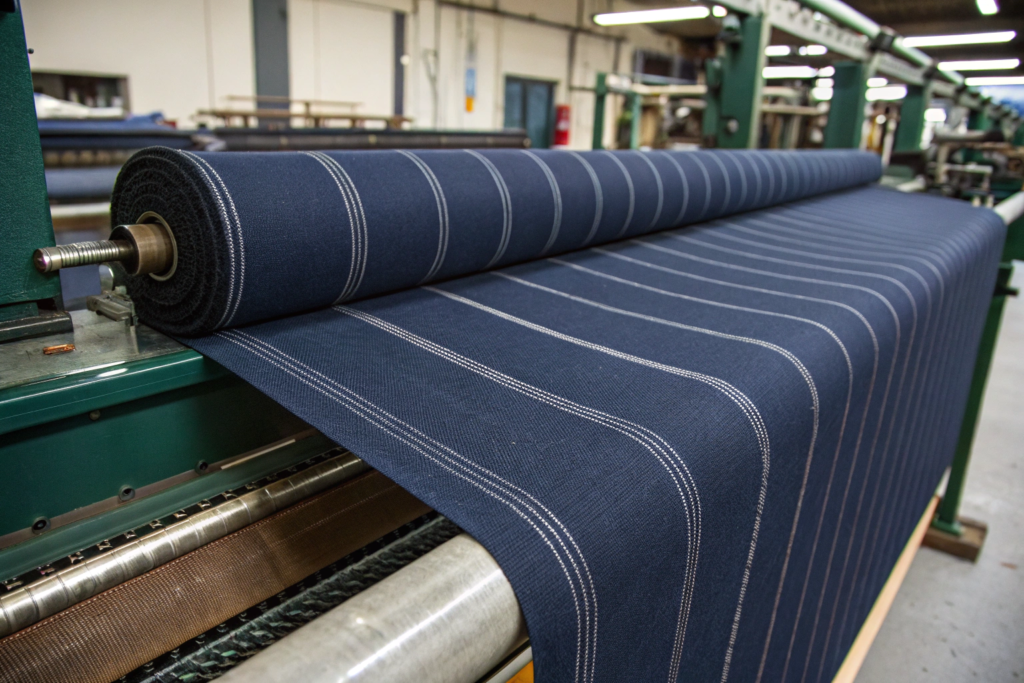
Imagine a greige fabric defect so subtle that it passes the loom’s electronic sensors and the off-loom inspection, only to explode into visibility after dyeing—a faint, repeating horizontal stripe across 800 yards of what should have been a flawless navy suiting. That’s the nightmare of post-dye defect revelation. The dye didn’t cause the stripe; the loom’s weft tension varied by 2 centinewtons due to a worn rapier wheel bearing that no alarm flagged because the fluctuation was within the machine’s 5-centinewton tolerance band. The mill shipped 800 yards of apparently clean greige into the dye bath, and 800 yards of trash came out the other side. Your production deadline is blown, and the mill blames the dyer.
At Shanghai Fumao, our weaving QC philosophy treats greige not as a semi-finished commodity but as the structural skeleton onto which everything else—color, finish, hand feel—is built. If the skeleton is crooked, no amount of dye or softener can straighten it. We deploy a three-part defense on the weaving line: incoming yarn certification, in-process monitoring on every single meter, and a greige inspection gate that uses a combination of automated vision and human craft judgment. The Uster Quantum 3 yarn clearer on each cone winding station measures every millimeter of yarn for diameter variation, hairiness, and foreign fiber contamination before the yarn even enters the creel. If a yarn lot’s CVm exceeds our specification—typically 12.5% for ring-spun cotton, 10% for compact—the entire lot is rejected back to the spinner before a single pick is inserted. This upstream rejection costs us planning headaches but prevents downstream disasters.
On the loom itself, we have retrofitted our rapier and air-jet machines with a digital camera array—a BMS Vision system from a Belgian supplier—that images the fabric surface at 120 frames per second, comparing each frame to a golden reference image of the approved weave structure. The system flags anomalies in real time: missing ends, double picks, broken filaments, start marks, reed marks. But here’s the critical nuance: the electronic system is tuned to be hyper-sensitive, flagging anything that deviates from the golden reference by more than 2%. This generates a lot of false positives—roughly 15% of the flagged "defects" are actually acceptable variation. A human inspector reviews every single flag. That’s the craft layer that pure automation misses. The machine doesn’t get tired or distracted; the human doesn’t get fooled by an optical artifact. Together, they catch what neither would catch alone.
what causes warp streaks in woven fabric and how are they prevented
Warp streaks—those maddeningly faint, continuous lines running the length of the fabric—are almost always a yarn-level problem that weaving amplifies. They start when a single warp yarn, or a small group of warp yarns, has a slightly different diameter, twist, or tension than its neighboring ends. This difference alters the way the yarn packs against the adjacent ends at the fell of the cloth, creating a microscopic ridge or valley that catches dye differently and reads as a visible line after finishing. The root cause might be a slightly worn heddle eye that is abrading one yarn and making it thinner, a tension variation from an incorrectly calibrated warp let-off motion, or a batch mixing on the warping beam where a cone from a different spinning lot was accidentally spliced in.
Our prevention starts at warping. We do not mix yarn lots on a single beam, ever. If a beam requires 500 ends and we only have 480 ends from Lot A, we do not splice in 20 ends from Lot B to make up the difference; we spin a new Lot A cone specifically for the balance. That costs extra spooling time but eliminates the number one cause of mixed-yarn streaks. During warping, every end passes through a tension sensor on the Karl Mayer warping machine that records the tension profile end-by-end, flagging any end that deviates more than 1.5 centinewtons from the beam average. The warper operator can correct the tension at the source before the beam is loaded onto the loom.
Once weaving starts, our BMS camera clusters are positioned at three fixed locations across the 2.2-meter weaving width—left, center, and right—to detect the earliest visual signature of a streak. A trained human inspector also pulls a 1-meter sample from the left and right selvedge every two hours and examines it under low-angle raking light, which reveals subtle surface texture differences that flat overhead lighting misses. If a streak is detected, the loom is stopped, the offending end is identified by sequentially releasing warp ends with a hook until the streak disappears, and the end is replaced or re-tensioned. The process takes 15 minutes and costs about 5 yards of scrap. Without it, a streak runs undetected for 800 yards and ruins the entire production. Some real technical write-ups about how to diagnose and eliminate warp streak defects in high-density shirting through yarn lot management and tension measurement suggest that batch integrity on the warping beam is the single highest-leverage intervention.
how does automated yarn inspection prevent invisible fabric flaws
Invisible flaws are the ones that pass visual inspection on the greige table but materialize after dyeing or washing. The most common culprit: low-level foreign fiber contamination—a single polypropylene fiber from a bale wrapping that got mixed into the cotton during ginning. Polypropylene does not absorb reactive dye; it stays pure white against a dark navy background, creating a tiny but glaring white speck on the finished garment. Under greige inspection, it’s invisible because it’s also white against the white cotton background. Only after dyeing does the sin become visible.
Our Uster Quantum 3 yarn clearers detect foreign fibers using a multi-spectral light source that illuminates the yarn from three angles with different wavelengths. Polypropylene reflects UV light differently than cotton; the sensor identifies the foreign fiber signature and the clearer unit cuts it out and splices the yarn cleanly. The removal rate we target is 98% of foreign fibers above 1 millimeter in length. No system catches everything, but catching 98% changes the finished fabric from "speckled with white dots and unsellable" to "commercially acceptable with occasional small specks that fall within AQL 2.5."
Another invisible flaw is dead cotton—cotton fibers that never matured fully and appear as flat, ribbon-like fibers under a microscope. Dead cotton does not absorb dye normally; it takes up less color and appears as a lighter patch on the fabric surface. Dead cotton is detectable on the Uster as an abnormal diameter signature: the flat fiber creates a higher diameter reading than a healthy round fiber of the same mass because it presents a wider cross-section to the optical sensor. A quality control methodology that incorporates the latest high-speed spinning clearer technology in grading and inspecting yarn before weaving allows mills to set a dead-cotton threshold specific to the expected dye depth, with lighter shades requiring tighter thresholds because the contrast between normal and dead cotton is more visible against a pale background.
Dyeing QC: The Spectrophotometer Never Lies
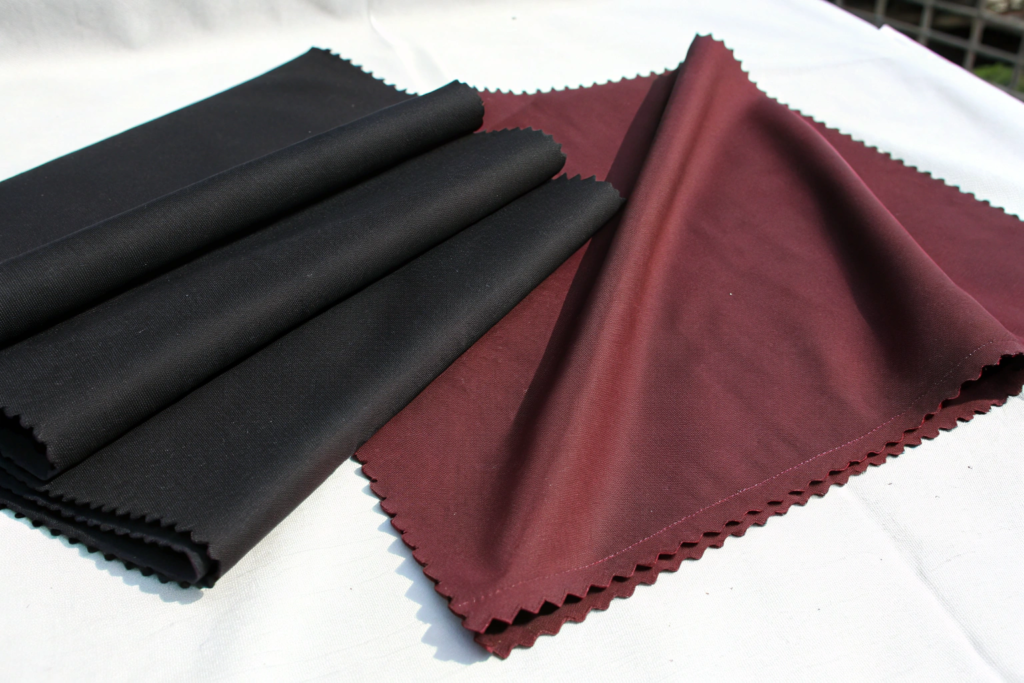
You have held two "identical" black polyester swatches under the boutique’s warm halogen spotlights and they looked perfectly matched. Then the customer walked to the window where daylight streamed in, and suddenly one panel was jet black while the other was a distinct brownish burgundy. That’s metamerism—the color-shift illusion that only reveals itself under a different light source—and it is the most terrifying word in the dye house. You shipped a garment where the body fabric and the trim fabric matched under the factory’s fluorescent tubes but mismatched under natural daylight, and now the retailer is issuing a recall because the garment looks defective on display. The dye house’s single-light-source quality control failed you.
At Shanghai Fumao, our dyeing QC is built around a single, non-negotiable instrument: the Datacolor 850 spectrophotometer, calibrated every four hours against a certified white tile standard. Every single dye batch—no exceptions, no "rush job" exemptions—is measured against the approved lab dip standard under three illuminants simultaneously: D65 (daylight), TL84 (store lighting), and A (incandescent home lighting). The software calculates the Delta E CMC value for each illuminant, and we require a pass of 0.8 or below for dark shades and 0.5 or below for pastels on all three illuminants before the batch is released to finishing. If the Delta E on TL84 is 0.6 but the Delta E on D65 is 1.2, the batch fails. No negotiation. The batch is reworked or scrapped, and the dye master must diagnose and correct her recipe. This multi-illuminant requirement costs us roughly 3% of batches in rework, but it eliminates metamerism complaints entirely.
But the spectrophotometer is only as honest as the sample it measures. A common industry cheat is to measure a "sweet spot" on the fabric—a section that happens to match the standard—while ignoring the selvedge or the center. Our protocol demands three measurements per roll: left selvedge, center, right selvedge. All three must pass. A batch with a perfect center and a 1.5 Delta E left selvedge is a failed batch, because the cutting table will produce some garment panels that match and some that don’t, creating a shading problem on the rack. The three-point measurement catches the center-to-selvedge variation that lazy single-point sampling misses, and it forces the dye house to maintain level dyeing conditions across the entire fabric width.
why do fabric colors look different under store lights vs daylight
The short answer: the light source’s spectral power distribution curve determines which wavelengths of light hit your eye. A dye molecule absorbs specific wavelengths and reflects others. Under a D65 daylight simulator, which emits a balanced spectrum across all visible wavelengths, you see the "true" color produced by the dye’s full absorption spectrum. Under a TL84 fluorescent store light, which emits strong peaks in the green and orange wavelengths but weak emission in the red and blue, the same dye molecules are illuminated differently—the greens and oranges are amplified, the reds are suppressed—and your brain interprets a different color entirely. The fabric hasn’t changed; the information reaching your retina has.
Metamerism occurs when two dye formulations achieve the same D65 color match using different combinations of pigments that respond differently to the spectral spikes of TL84. One lab dip might match the pantone using a blend of navy blue and black disperse dyes; another might match using a blend of navy blue and red disperse dyes. Under D65, they look identical. Under TL84, the navy-and-red blend suddenly reveals the hidden red component because TL84’s red emission spike energizes the red dye’s reflection, while the navy-and-black blend stays neutral. The two fabrics, which matched perfectly in the light booth we approved them under, now clash violently in the retail store. Understanding how metameric color matching in textile dyeing fails under multi-illuminant conditions is fundamental to grasping why a spectrophotometer that only measures under one light source is actively misleading you.
Our defense is proactive: when we formulate a dye recipe, we simulate the reflectance curve against the pantone standard across all three illuminants in the Datacolor Match software before we ever mix a gram of dye. The software predicts the metamerism index and flags recipes with a high risk of illuminant sensitivity. We reformulate prophylactically. The incremental cost is an extra hour of colorist time per new shade; the avoided cost is a container of garments rejected at the destination port for color mismatch.
how is batch to batch shade consistency actually measured
Batch-to-batch shade consistency is measured not by the naked eye but by a process called "shade banding." At the start of bulk production, the first production batch becomes the "master standard"—the physical reference roll against which every subsequent batch is measured. A 5-yard swatch from the master standard is cut, sealed in a black polyethylene bag to prevent light degradation, and stored in a humidity-controlled archive at 20 degrees Celsius and 55% relative humidity. Every time a new bulk batch comes off the stenter, a sample is conditioned in the same environment for four hours (to normalize moisture content, which affects reflectance), and then measured in the spectrophotometer against the master standard sample.
The software calculates the Delta E CMC between the new batch and the master under D65 illumination. Our internal pass threshold for batch-to-batch is tighter than the initial lab-dip-to-bulk threshold: 0.6 maximum for dark colors, 0.4 for lights. If a batch fails, it does not ship. It is either re-dyed back to shade by adjusting the dye recipe based on the spectrophotometer’s "add" recommendation, or it is graded as B-stock and sold at a discount to a different market where slight shade variation is acceptable (such as promotional merchandise). The master standard is replaced annually as the original sample ages, and the replacement is cross-measured against the original to ensure no calibration drift over time.
The physical archive of shade standards is also our legal defense against shade complaints. If a customer claims that Batch 5 does not match Batch 2, we retrieve both archived samples, condition them, and remeasure them side-by-side on the spectrophotometer in the presence of the customer or a third-party inspector. The data settles the argument objectively. In 2023, a European outerwear brand challenged a batch shade on 5,000 yards of olive drab nylon, claiming a visible mismatch. Our archived samples showed a Delta E of 0.5 between the disputed batch and the master; the customer’s claimed mismatch was an artifact of their inspection room’s aging fluorescent tubes, which had an incorrect color temperature. We replaced the fabric as a goodwill gesture, but the forensic data proved that our process was correct.
Printing QC: Registration Accuracy Down To 0.5mm
You have a gorgeous, intricate floral pattern designed for a flowy viscose dress. The digital simulation looks perfect. The physical strike-off looks perfect. The bulk production arrives, and every single flower has a faint ghost image—a 1-millimeter shadow of magenta peeking out from behind the intended black outline. The design is ruined, the fabric looks cheap and blurry, and your brand’s "artisan print" narrative collapses into customer complaints about "defective pattern." The printer didn’t maintain registration tolerance between the color separations, and you didn’t know to ask for a registration specification. You just assumed "digital" meant "perfect."
At Shanghai Fumao, our printing QC across both digital and rotary screen lines is anchored to a registration tolerance of 0.5 millimeters. That’s the maximum allowable misalignment between any two color separations in the print. For context: the human eye can perceive misregistration at about 0.3 millimeters on a high-contrast border like a black outline against a white background. Our 0.5mm spec means the misregistration might be barely detectable under a loupe, but at normal viewing distance—a garment on a body, a curtain on a window—it is invisible. We verify this on every single production run by printing a registration mark array along the selvedge: a series of crosshairs with each color separation that, when perfectly aligned, forms a single sharp cross. If any color is offset, the crosshair splits, and the press operator can measure the offset directly with a pocket microscope and adjust the print head or screen position until the misregistration falls below 0.5mm.
But registration is only one dimension of print QC. We also monitor color density, penetration, and wash fastness. On the digital line, the print heads are cleaned and nozzle-checked every four hours of continuous operation, and a test print of a standardized calibration pattern is measured with an X-Rite eXact spectrophotometer to verify that each ink channel is delivering the correct color density to within a Delta E of 1.0 against the approved color profile. On the rotary screen line, the squeegee pressure and angle are set for each design and logged, and the operator checks for screen wear—the gradual enlargement of the screen mesh openings that causes color bleeding—every 5,000 linear meters.

how is digital print color accuracy maintained on long runs
Digital textile printers use inkjet heads with thousands of microscopic nozzles, each firing picoliter droplets of CMYK or extended-gamut ink. Over a long print run—say, 5,000 linear meters of fabric—the nozzles degrade. Some clog partially and fire smaller droplets; others drift in their firing angle due to ink residue buildup. The result is color drift: the fabric roll at the end of the run is visibly lighter or less saturated than the roll at the beginning, even though the printer’s software still thinks it’s printing the same profile.
We combat this with closed-loop color calibration. Every 200 linear meters of digital printing, the machine pauses automatically (we program the RIP software to insert these checkpoints) and prints a 21-step gray scale patch plus 12 specific color patches onto a test strip of the same fabric being printed. A spectrophotometer mounted on the printer carriage scans the dried test strip and compares the measured densities to the reference values stored in the ICC profile. If any ink channel has drifted by more than a Delta E of 1.5, the RIP software recalculates the ink curve for that channel—effectively telling the printer to fire slightly more or less ink to compensate for the nozzle degradation—and the run resumes with the corrected profile. This checkpoint process takes 90 seconds and costs about 50 cents in test fabric and ink. Without it, a 5,000-meter run ends with a Delta E shift of 3-4 in the worst channel, producing an obvious mismatch between the first and last garments cut from the run.
The print head maintenance protocol is equally critical. We cycle the heads through an automated purge and wipe sequence every four hours of continuous operation, even if the nozzle check shows all nozzles firing. This preventative purge clears partially-clogged nozzles before they become fully clogged. Some readers examining how to maintain inkjet color fidelity over long-format textile runs through closed-loop calibration will find that scheduled prophylactic head maintenance is far more effective than reactive cleaning after a nozzle failure is detected.
what causes print wash fastness failures and how are they tested
Print wash fastness failure—the heartbreak of a beautiful print that bleeds, fades, or cracks after five home laundry cycles—almost always traces back to inadequate fixation. In digital pigment printing, the pigment particles are bonded to the fabric surface with a chemical binder that must be heat-cured to cross-link and lock the pigment in place. If the curing temperature is too low, or the dwell time too short, or the fabric moisture content too high during curing, the binder does not fully cross-link, and the pigment particles release gradually with each wash, causing progressive fading and staining of adjacent white areas.
We verify fixation completeness with two tests. First, a dry crock test immediately after printing and curing: a white cotton swatch is rubbed against the print under 9 Newtons of force using a crock meter for 10 cycles, and the amount of color transferred to the white swatch is rated on the AATCC gray scale. Our acceptance threshold is a Grade 4 minimum (very slight color transfer) for dry crock. Second, an accelerated wash test per AATCC 61 2A (equivalent to five home launderings): the printed fabric is washed at 40 degrees Celsius with a standard detergent and multifiber witness strip attached. The witness strip must show no staining above Grade 4, and the print itself must show a Delta E shift of less than 1.0 versus an unwashed reference. If either test fails, we evaluate the curing parameters—temperature, dwell time, airflow in the stenter—and either re-cure the batch at a higher temperature or reject it if the failure indicates a binder compatibility problem with the specific fabric substrate.
For reactive dye printing on cotton and viscose, the fixation chemistry is different but the principle is the same: the dye must covalently bond to the cellulose fiber during steaming, and the unfixed dye must be thoroughly washed out. The wash fastness failure mode here is not binder cracking but "wet crocking"—color transfer when the fabric is damp. We test wet crock fastness after the standard AATCC 61 wash cycle, requiring a Grade 3.5 minimum, which is tighter than the commercial standard of Grade 3. This is a major point of professional discussion among colorists around how to diagnose poor print wash fastness due to binder polymerization failures versus inadequate steaming, and the testing pathway for each root cause is distinct.
Coating QC: Bond Strength That Survives Extreme Use
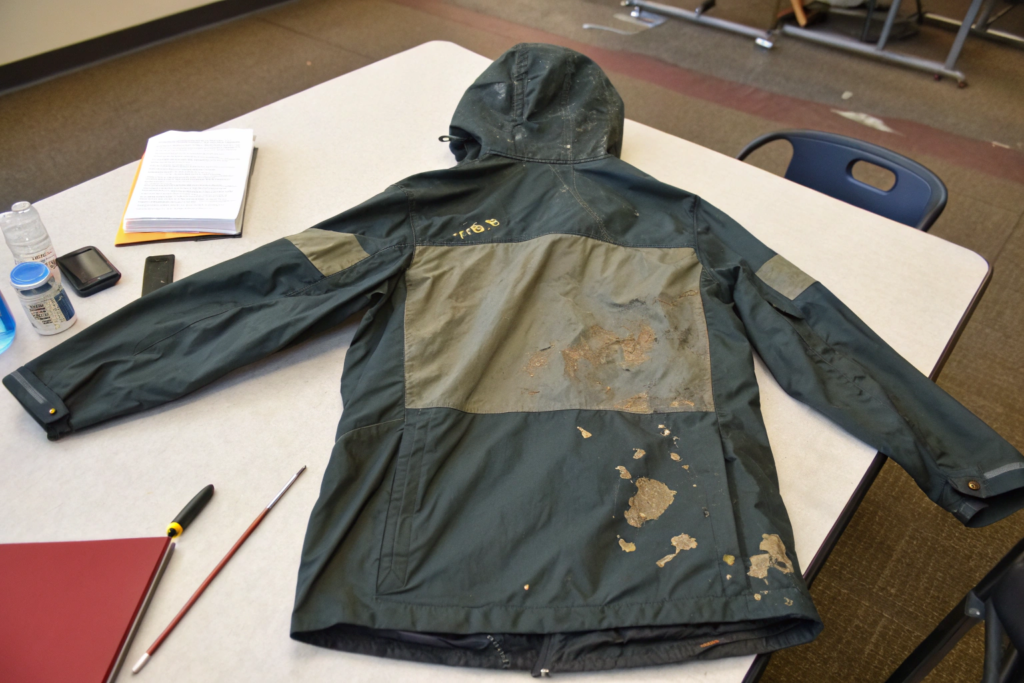
You designed a waterproof-breathable rain jacket for an outdoor brand. The membrane laminate looked perfect on the sample. Six months after launch, customers are reporting that the jacket "wets through" at the shoulders after thirty minutes of moderate rain. You test a returned jacket and discover the PU membrane has delaminated from the face fabric in patches across the back panel where the wearer’s backpack rubbed against it. The coating bond strength was too low to survive real-world use, and the coating QC at the mill probably consisted of a guy tugging at the corner of a swatch and nodding. Your product is now failing in the field, and your outdoor retailer account is on the verge of dropping your entire line.
At Shanghai Fumao, coating QC is quantified in Newtons, not opinions. Our standard test for laminate bond strength is ISO 2411: a 5-centimeter-wide strip of the coated fabric is mounted in a tensile tester, and the coating is peeled from the base fabric at a 180-degree angle at a speed of 100 millimeters per minute. The peel force is recorded continuously, and the average force over the peel distance is the bond strength. Our internal specification for a PU waterproof-breathable coating on nylon taffeta is a minimum of 15 Newtons per 5 centimeters. For a heavy-duty TPU coating on Cordura, the minimum rises to 25 Newtons. If a batch measures 14.5 Newtons, it fails. No rounding up, no "close enough." The batch is re-processed with an additional tie-coat primer layer, or the coating is stripped and re-applied, or the batch is sold as a lower-grade product with full disclosure that the bond strength does not meet our premium specification.
We also test for hydrolysis resistance—a critical parameter for PU coatings because polyester-based polyurethanes degrade in the presence of moisture and heat, a process called hydrolytic degradation that causes the coating to become sticky, then brittle, then cracked. Our hydrolysis test is ISO 1419 method C: the coated fabric is suspended in a humidity chamber at 70 degrees Celsius and 95% relative humidity for three weeks, then the bond strength is tested again. The bond strength retention after aging must be at least 70% of the original value. A coating that starts at 18 Newtons and drops to 10 Newtons after hydrolysis aging is a failed coating, even if the initial 18 Newtons passed the initial spec. This aging test catches the latent defect that causes field failures six months into use.
how is water column pressure tested for waterproof claims
Water column pressure, measured in millimeters, quantifies how much water pressure a coated fabric can withstand before water penetrates through. The test method is ISO 811 (or the equivalent AATCC 127): a 100-square-centimeter swatch of the coated fabric is clamped under a column of water, and the water pressure is increased at a rate of 600 millimeters-per-minute until the third water droplet appears on the underside of the fabric. The pressure at that moment, expressed in millimeters of water column, is the hydrostatic head rating. A fabric rated at 5,000mm will resist a 5-meter column of water pressure; a fabric rated at 20,000mm is suitable for extreme rain and snow conditions because it can resist the pressure of a human body pressing against wet ground.
Our testing rig is a Textest FX 3000 Hydrostatic Head Tester with a digital pressure transducer calibrated against a certified manometer every month. We run the test on five swatches cut from different positions across the coated width—left selvedge, center-left, center, center-right, and right selvedge—and the reported rating is the lowest of the five values, not the average. A coating might average 8,200mm but have a single weak spot at the center-right measuring 5,500mm; that 5,500mm is the effective rating because water will find the weakest point. This five-point sampling protocol is more stringent than the industry norm of three points, and it catches the edge-of-width coating thickness variation that causes premature wet-through at the garment’s side seams.
For waterproof breathable membranes, we also test after the standard AATCC 135 wash cycle to verify that the waterproofness is durable. Many coatings pass the initial hydrostatic head test but drop below 1,000mm after ten washes—functionally no longer waterproof. Our spec requires that the hydrostatic head after 20 wash cycles retains at least 80% of the original value. That means a 10,000mm initial rating must still measure 8,000mm after 20 washes. This is an aggressively high standard, and not all coating formulations clear it. We use an ether-based PU rather than the cheaper ester-based PU for waterproof applications specifically because ether-based PU is inherently hydrolysis-resistant and maintains its waterproofness through dozens of wash cycles.
why do some coated fabrics crack after cold weather exposure
Coating cracking in cold weather is almost always a glass transition temperature (Tg) problem. Every polymer has a Tg—the temperature below which the polymer transitions from a flexible, rubbery state to a rigid, glassy state. If a PU coating is formulated with a Tg of minus 5 degrees Celsius, it remains flexible down to minus 5 degrees; if the garment is worn in minus 15-degree conditions, the coating becomes brittle and cracks when flexed. Cheap coating formulations use high-Tg polymers because they cost less; premium formulations use low-Tg polymers with plasticizers that depress the glass transition further.
We qualify every coating formulation for cold-weather flexibility using a low-temperature bend test based on ISO 4675. The coated fabric is conditioned at the target temperature (typically minus 20 degrees Celsius for technical outerwear) for four hours, then a specimen is bent 180 degrees over a mandrel with a diameter equal to the fabric thickness, while still at that temperature. The bent area is then examined under a 10x magnifier for cracks. If any cracks are visible, the coating formulation fails. We also test after the 3-week hydrolytic aging protocol described earlier because hydrolysis can leach plasticizers out of the coating, raising the effective Tg over time. A coating that passes the cold bend test fresh might fail after hydrolysis aging because the loss of plasticizer has raised its Tg above the test temperature.
The most robust formulations we use for expedition-grade outerwear are based on polyether TPU with a polymeric plasticizer that is covalently bonded to the TPU backbone and cannot be leached out by hydrolysis. This raises the raw material cost by about $0.35 per yard compared to a standard ester-PU with monomeric plasticizer, but it guarantees cold-weather flexibility for the functional life of the garment. If your market includes Scandinavian winter, Canadian winter, or alpine environments, this is not an optional upgrade; it’s the only chemistry that works. Field reports and technical analyses of cold-cracking mechanisms affecting flexible polymer coatings and their low-temperature performance characteristics often demonstrate that the plasticizer migration rate in wet conditions is the true determinant of long-term cold-weather durability, not the initial Tg measurement on fresh film.
Finishing QC: The Hand-Feel Consistency Standard
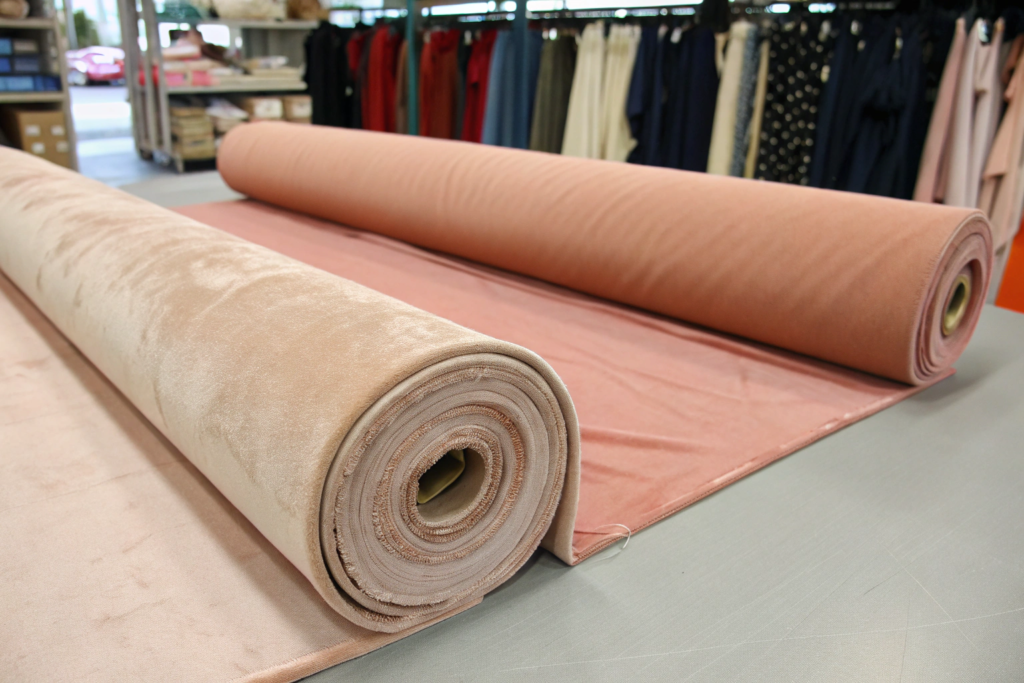
You order a brushed peached-finish fabric for a premium loungewear line. The sample feels incredible—soft, sueded, buttery against the skin. The bulk order lands, and half the rolls have that same divine hand feel, but the other half feel… flat. Still soft, but lacking that micro-sueded peach-skin texture. Your cutting room spreads the rolls and cuts 400 units; the garments that came from the "good" rolls sell out immediately with five-star reviews; the garments from the "flat" rolls generate complaints about "not as soft as described" and "feels different from my first order." You have an inventory nightmare: two distinct product qualities from one production run, all because the finishing line didn’t control the peaching parameters across the entire batch.
Finishing is where fabric acquires its final personality—the hand feel, the drape, the surface texture, the luster level. It’s also where QC is most often neglected because finishing parameters are harder to quantify than a dye shade or a tensile strength. At Shanghai Fumao, we quantify hand feel obsessionally, using the Kawabata Evaluation System (KES) to measure bending rigidity, surface friction, compression, and tensile linearity on every finishing batch. For a peach-finish fabric, the critical parameter is the surface roughness measured by the KES friction probe: a 0.5-millimeter-diameter steel wire is dragged across the fabric surface at 1 millimeter per second, and the resulting friction trace shows the peaks and valleys of the microtexture. The mean deviation of the friction coefficient—the surface roughness index—must fall within a band of ±0.002 for the batch to pass. That sounds impossibly tight, but human fingertips can detect roughness differences of about 0.005, so we need to be tighter than human perception.
Beyond the KES, we maintain a physical "hand feel archive"—a library of approved finishing standards for each fabric SKU, stored in sealed glass jars to prevent contamination. Every finishing batch is compared to the archive standard by the same senior technician, using the same hand, at the same ambient temperature and humidity (because skin sensitivity varies with those factors). The technician’s pass/fail call is subjective, but the subject matter expert has been calibrating his hand against the archive for over a decade, and his subjective call correlates with the KES objective measurement over 98% of the time. The machine validates the human; the human validates the machine.
how is fabric softness objectively measured and controlled
Fabric softness is not a single physical property; it is a composite of low bending rigidity (the fabric bends easily under its own weight), low surface friction (the fingertips glide across the surface without resistance), and high compressibility (the fabric yields under finger pressure rather than resisting). The KES system independently measures all three. Bending rigidity is measured by clamping the fabric and bending it 150 degrees in both directions; the moment required per unit width is the bending rigidity, measured in grams-force per centimeter-squared per centimeter. For a soft loungewear fabric, we target a bending rigidity below 0.05 gf·cm²/cm. Surface friction is measured with a contactor that mimics a fingerprint, and we target a coefficient of friction below 0.20.
The finishing lever that controls softness is the application of a cationic softener—a positively charged surfactant that bonds to the negatively charged fiber surface and reduces friction. But the softener must be applied at exactly the right concentration and with exactly the right dwell time on the stenter padder. Too little softener, and the fabric feels harsh. Too much, and the excess softener sits on the surface as a greasy film that attracts dirt and causes the fabric to lose its softness after a few washes (because the excess washes off, leaving less than the intended amount behind). We verify the softener add-on percentage by measuring the weight difference between a fabric swatch before and after extracting the softener with a solvent in a Soxhlet apparatus. The target add-on for our standard silicone softener is 0.8% of fabric weight. Anything below 0.6% fails; anything above 1.0% fails for potential surface greasiness. The extraction test is performed on three swatches from each finishing batch.
Temperature and tension during stentering also affect softness. If the stenter is run too hot or the fabric is stretched too tight in the weft direction during drying, the fibers are set in a strained position and cannot relax into a soft configuration. We dry at 130 degrees Celsius maximum for cotton and 110 degrees Celsius for viscose, with a weft overfeed of 8-12% depending on the construction, to ensure the fabric retains some shrinkage allowance and does not set hard. If you ever want to dig deeper, there are excellent resources on Kawabata-driven softness optimization and process control parameters for finishing that detail how individual machine variables shift the KES readings.
why does dimensional stability matter for garment manufacturing
Dimensional stability—the remaining shrinkage potential in the finished fabric—is the hidden parameter that makes or breaks a cut-and-sew operation. A garment pattern is sized to exact body measurements, with allowance for the intended ease. If the fabric shrinks 5% in length and 3% in width after the garment is assembled and laundered, the medium jacket becomes a small, the sleeve length shortens by an inch and a half, and the entire size grading is corrupted. The customer buys a medium, washes it once, and now owns a mislabeled small.
At Shanghai Fumao, we manage dimensional stability by over-engineering the finishing shrinkage to release all latent shrinkage before the fabric leaves our facility. Our finishing protocol on the stenter includes a "shrinkage plateau" step: after the fabric is dried and set, we run it through a Sanforizing compressive shrinkage unit (for wovens) or a compacting calender (for knits) that mechanically forces the fabric to shrink under controlled compression and heat. We target a residual shrinkage after the Sanfor process of 0.5% maximum in the warp direction and 1.0% maximum in the weft, measured by the AATCC 135 home laundry test (warm wash, tumble dry medium). If the test swatch shrinks more than the spec, the entire batch is re-compacted until it passes.
For knit fabrics, the dimensional stability challenge is compounded by the fact that knit loops can relax and distort over time, not just in washing. We pre-relax every knit fabric in open-width form for 48 hours at 65% relative humidity and 20 degrees Celsius before cutting the shrinkage test sample, to ensure the shrinkage measurement represents the fabric’s fully relaxed state, not a transient state it will leave in two days. This pre-relaxation step requires floor space and patience, and many mills skip it, producing shrinkage test results that look acceptable but are artificially low because the fabric had not yet fully relaxed from the tension of finishing. The garments then shrink unexpectedly when the customer washes and tumble-dries them, triggering the garment manufacturer’s nightmare: "size inconsistency" on the quality complaint form.
Conclusion
So, how strict is our quality control across these five production lines? Strict enough that we scrap or rework roughly 3-5% of our total linear yardage before it ever reaches a customer. Strict enough that our QC gate inspectors have the authority to stop a production run dead—and exercise that authority weekly—without needing approval from anyone in management. Strict enough that we measure color under three light sources, bond strength after three weeks of hydrolysis aging, and hand feel with an instrument that quantifies surface roughness to three decimal places. This strictness is not a marketing posture; it is a calculable cost of doing business that appears in our P&L as rework, scrap, testing labor, and idle machine time waiting for QC clearance. I accept that cost because I refuse to accept the larger cost of shipping defective fabric and losing a customer permanently.
The five lines—weaving, dyeing, printing, coating, and finishing—each operate with dedicated instrumentation, defined tolerances, and qualified human judgment that knows when to overrule the machine. The Uster clears the yarn, the BMS cameras watch the loom, the Datacolor spectrophotometer measures three illuminants, the Textest hydrostatic head rig tests five points across the width, the Kawabata evaluation system quantifies what fingers feel. Each instrument generates data; each data point is logged and traceable by batch number; each log is auditable by a customer or a third-party inspector on a factory visit. There are no black boxes.
If you are evaluating Shanghai Fumao for a project where quality is genuinely non-negotiable—where a failed fabric lot means missed retail windows, chargebacks, brand damage, and personal professional embarrassment—then ask for the data. Ask for the Uster yarn evenness report for your specific yarn lot. Ask for the three-illuminant Delta E measurements on your dye batch. Ask for the five-point hydrostatic head results on your coated fabric. I keep these records because I built a QC system that produces them, and I want customers who care enough to read them. Contact our Business Director, Elaine, at elaine@fumaoclothing.com. Tell her which production line you have questions about. She’ll send you sample QC reports and arrange a factory call where you can walk the inspection gates virtually and see the instruments in operation. Because the only way to trust quality control is to see the data yourself.