
After twenty years running fabric production in Keqiao, I've seen spectrophotometers collect dust in corners while teams argue about color matches. The truth is, owning the instrument means nothing if you're not using the right settings. I've personally witnessed six-figure losses from incorrect spectrophotometer configurations that could have been prevented with proper setup.
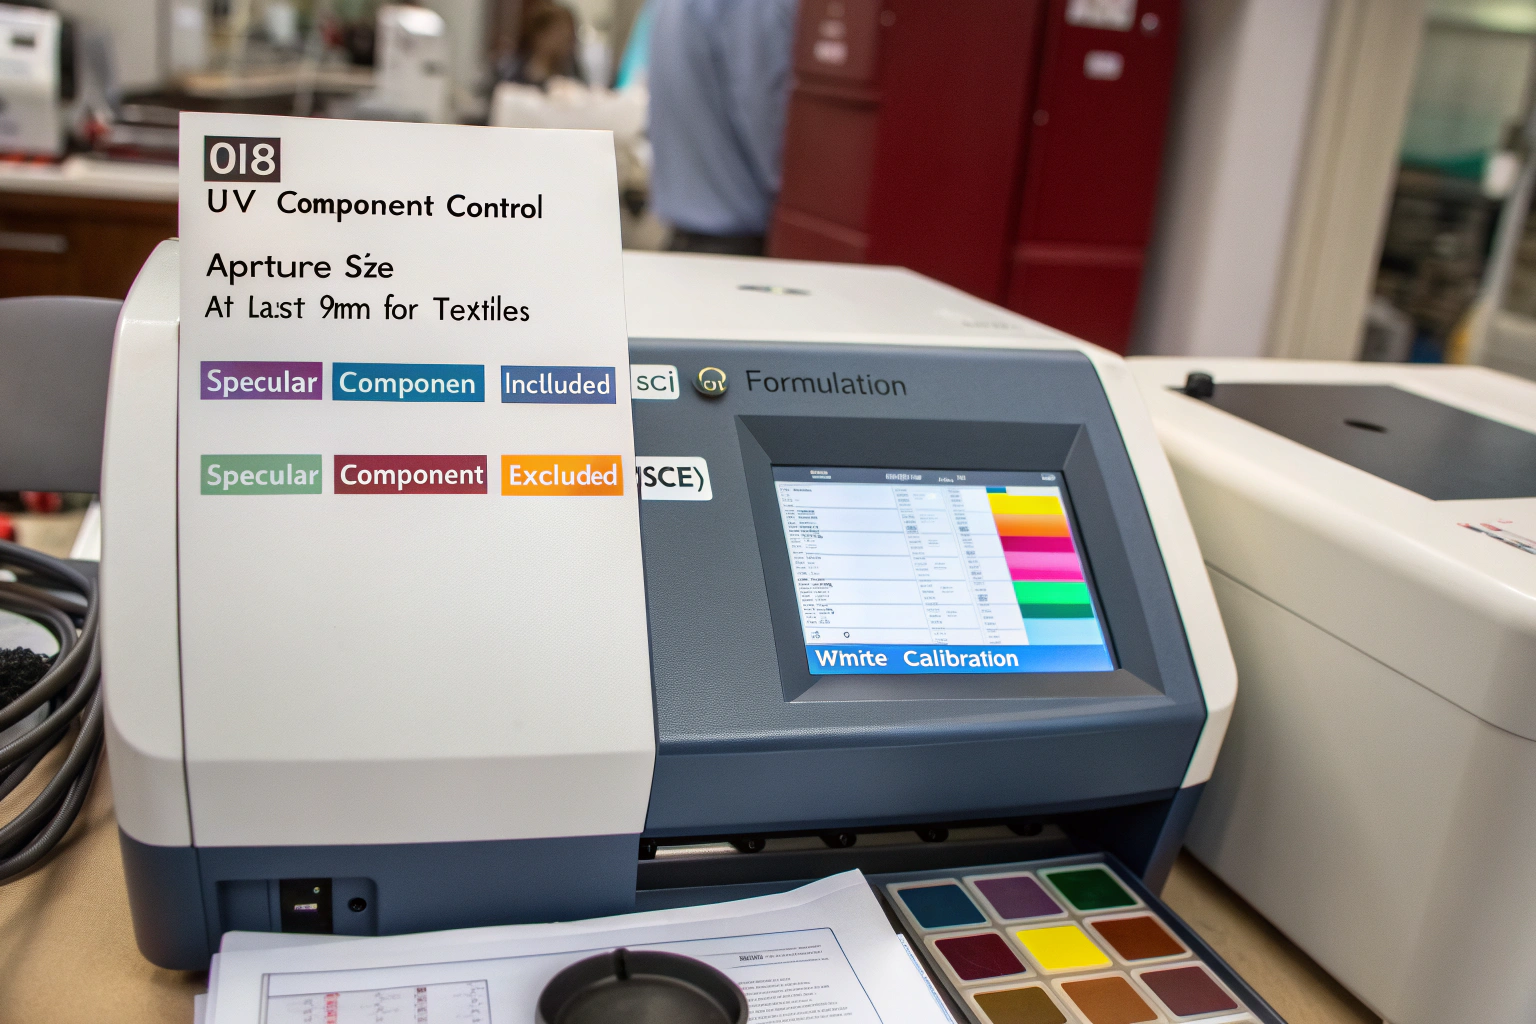
The most critical spectrophotometer settings for fabric color QC are the measurement geometry (d/8° with UV component control), aperture size (at least 9mm for textiles), specular component included (SCI) for formulation, specular component excluded (SCE) for visual matching, and the proper white calibration before each session. These five settings form the foundation of reliable color measurement, while secondary settings like filter selection and measurement timing ensure consistency across operators and facilities.
Let me share a painful lesson from early in my career. We lost a major client because our lab and production facility used different aperture sizes—the lab used 6mm for small swatches while production used 14mm for bulk fabric. The measurements never aligned, causing constant disputes. Once we standardized to 9mm across all departments, our color approval rate jumped from 65% to 92% almost overnight.
Why Does Measurement Geometry Dominate Accuracy?
Measurement geometry—how light hits the sample and how the instrument captures the reflection—is the single most important setting because it determines how closely instrumental measurement matches human visual assessment. Get this wrong, and your numbers will never align with what eyes actually see.
The textile industry standard is d/8° (diffuse illumination, 8-degree viewing) geometry with UV control. This configuration most closely replicates how we evaluate colors in standard viewing booths. The inclusion of UV control is particularly crucial for fabrics with optical brighteners, which are present in most white and bright-colored textiles.

How Does d/8° Geometry Mimic Human Vision?
The d/8° geometry illuminates the sample diffusely (from all directions) and measures the reflected light at an 8-degree angle. This matters because it captures both the color and the texture influence—exactly how human eyes evaluate fabrics under standard lighting conditions.
When we switched from 45/0° geometry to d/8° in 2018, our correlation between instrumental measurements and visual assessments improved dramatically. The delta E values started making sense—a ∆E of 1.0 now consistently represented what our experienced colorists would call a "commercial match" rather than the confusing variations we saw previously.
Why is UV Control Non-Negotiable for Textiles?
UV control manages the ultraviolet component in the illumination, which critically affects fabrics with optical brightening agents (OBAs). Without UV control, your white fabrics will measure differently under various light sources, creating the metamerism issues that destroy color approval processes.
We supply technical fabrics to a Swiss medical wear company that requires precise whiteness measurements. Before implementing UV calibration, their "surgical white" varied by up to ∆E 3.5 between measurements. After configuring UV control at 100% UV inclusion, the variation dropped to ∆E 0.3, finally meeting their stringent quality requirements.
How Do Aperture Size and Measurement Mode Affect Results?
Aperture size determines how much fabric you're measuring, while measurement mode (SCI vs SCE) determines whether you're capturing total appearance or just the color. These settings must match your fabric characteristics and quality standards.
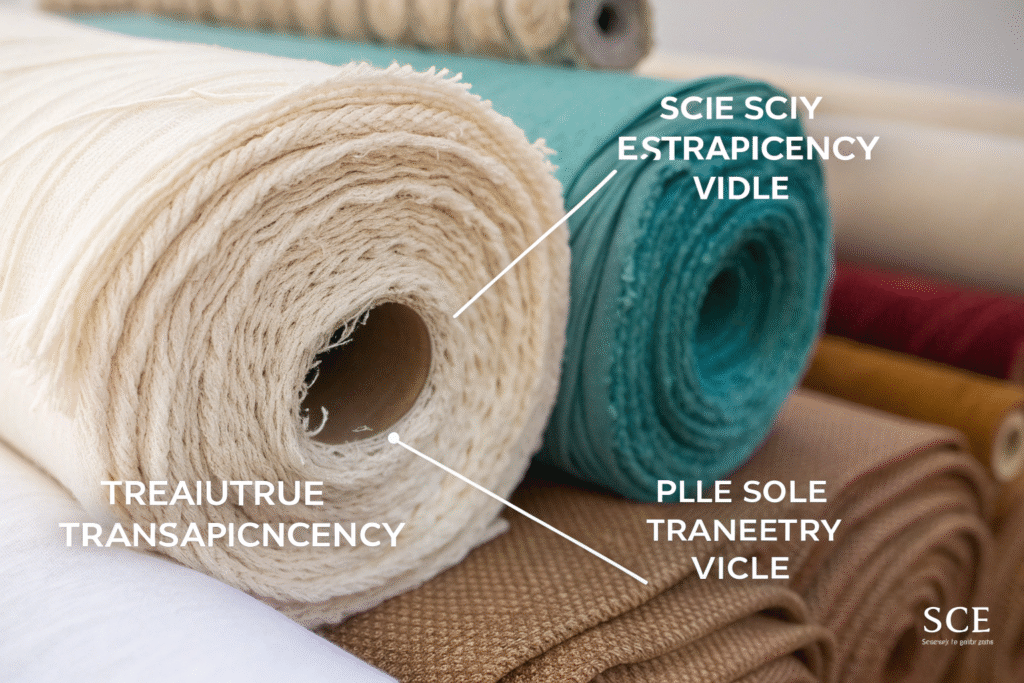
Textiles present unique challenges—they have texture, pile, and sometimes translucency. A small aperture might measure between threads while a large aperture captures the overall appearance. Similarly, the choice between SCI and SCE determines whether you're measuring the true color or the visual appearance.
What Aperture Size Works Best for Different Fabrics?
The aperture size must be large enough to average out fabric texture but small enough for practical measurement. Through thousands of tests, we've established these guidelines:
| Fabric Type | Recommended Aperture | Rationale |
|---|---|---|
| Standard wovens & knits | 9-12mm | Balances detail with averaging |
| Large patterns | 15-20mm | Captures overall color effect |
| Narrow ribbons/trims | 6-8mm | Fits small areas |
| Pile fabrics (velvet) | 15-25mm | Averages pile direction variation |
| Sheer fabrics | 9mm with backing | Prevents background influence |
For general textile work, 9mm has become our standard—it's large enough to average minor texture variations but small enough for lab dips and production cuttings. When we audited our supplier factories last year, we found that those using 9mm aperture had 40% fewer color disputes than those using random sizes.
When Should You Use SCI Versus SCE?
SCI (Specular Component Included) and SCE (Specular Component Excluded) represent the most misunderstood setting pair. SCI includes the glossy reflection and measures total appearance—use this for lab dip formulation and digital color communication. SCE excludes the gloss and measures only the matte color—use this for visual matching against physical standards.
Here's how we apply them:
- SCI for all development work because it captures the complete color information
- SCE for production QC when matching to approved physical standards
- Always document which mode was used for each measurement
A German automotive fabric supplier learned this distinction painfully when their SCI-measured lab dips approved perfectly, but the SCE-measured production lots failed. The difference? The production fabric had a different surface texture that changed the gloss component. Now they specify measurement mode in their technical sheets.
What Secondary Settings Impact Textile Measurement?
Beyond the primary settings, several secondary configurations significantly impact measurement consistency, especially when multiple operators or instruments are involved. These include the number of measurements, measurement timing, and filter selection.
While these might seem like minor technicalities, in high-volume production, small inconsistencies multiply into major quality issues. We've standardized these secondary settings across our entire supply chain to ensure that a measurement in Vietnam means the same thing as a measurement in China.

How Many Measurements Ensure Statistical Reliability?
Single measurements are worthless for textiles due to inherent surface variation. We require three measurements with sample repositioning between each, discarding the highest and lowest L* values and averaging the remainder. This simple protocol catches localized color variations that single measurements miss.
When we implemented this triple-measurement protocol for a Japanese uniform company, their batch-to-batch consistency improved by 30%. The system caught slight side-to-center shading that single measurements had missed, preventing several potential production rejections.
Why Do Measurement Timing and Filters Matter?
Measurement timing controls how long the instrument waits before taking readings—crucial for ensuring the instrument stabilizes. We set a 2-second delay after aperture closure to allow for instrument stabilization, particularly important in humid environments common in dye houses.
Filter selection determines which mathematical color space the instrument uses. We standardized on CIE Lab with D65/10° for all client communications, as this combination aligns with most global brand standards. The specific understanding of CIE Lab color space for textile applications is essential for interpreting results correctly.
How Should You Establish Standard Operating Procedures?
The best spectrophotometer settings are useless without consistent application. We've developed detailed SOPs that every operator follows, complete with calibration checks, measurement protocols, and documentation requirements.
Color measurement isn't a casual activity—it's a precise scientific process that demands rigor. Our SOPs have reduced operator-induced variation by 75% and made training new technicians significantly faster and more reliable.

What Should Your Daily Calibration Routine Include?
Daily calibration is non-negotiable. Our routine includes:
- 30-minute instrument warm-up before first use
- White tile calibration using the master tile stored in darkness
- Black trap measurement to verify proper function
- Standard sample measurement to track instrument drift
We maintain a "control fabric" that we measure daily and track in a statistical process control chart. When measurements drift beyond 0.2 ∆E from the established baseline, we service the instrument. This proactive approach identified a failing light source before it affected production decisions.
How Do You Document Settings for Supply Chain Alignment?
We created a "Spectrophotometer Settings Sheet" that travels with every color standard. This documents:
- Instrument make and model
- Measurement geometry
- Aperture size
- UV filter position
- Measurement mode (SCI/SCE)
- Standard observer and illuminant
- Number of measurements
This simple document eliminated 80% of the arguments we previously had with overseas partners about whose measurements were "correct." Now we all measure the same way, and the numbers actually align.
What are the Cost Implications of Proper Setup?
Proper spectrophotometer configuration requires initial investment in training, standardization, and documentation, but the return is substantial and rapid. The cost of incorrect color decisions dwarfs the investment in proper setup.
We calculated that before standardization, color-related disputes cost us approximately 3% of revenue through reworks, delays, and lost business. After implementation, this dropped to 0.5%, representing a 600% ROI in the first year alone.

How Much Does Proper Implementation Cost?
The investment breakdown includes:
- Spectrophotometer: $4,000-8,000 for textile-capable models
- Training: $500-1,000 per operator
- Standardization materials: $1,000-2,000 initially
- Documentation systems: $500-1,000 setup
The total $6,000-12,000 investment seems substantial until you consider that a single rejected shipment typically costs $20,000-50,000. For most companies, preventing just one rejection pays for the entire system.
What ROI Can You Realistically Expect?
Our clients typically achieve:
- 60-80% reduction in color-related disputes
- 40-60% faster color approval cycles
- 30-50% reduction in lab dip iterations
- 25-40% improvement in production first-pass yield
An American sportswear brand tracked their metrics before and after implementation and found they reduced color development time from 28 days to 16 days while improving their production match rate from 72% to 89%. The time savings alone justified their investment within six months.
Conclusion
Spectrophotometer settings aren't technical minutiae—they're the foundation of reliable color management. The right configuration transforms color quality control from subjective opinion to measurable science. While the initial setup requires careful attention to geometry, aperture, measurement mode, and calibration protocols, the resulting consistency pays dividends through reduced disputes, faster approvals, and improved customer satisfaction.
At Fumao Textiles, we've standardized spectrophotometer settings across our entire supply chain, from our CNAS-certified lab to our production partners. This investment in measurement integrity has become a key competitive advantage, particularly for global brands requiring color consistency across multiple manufacturing locations. We don't just measure color—we build measurement systems that deliver reliable results. If you're struggling with color consistency, contact our Business Director Elaine at elaine@fumaoclothing.com. Let's bring scientific precision to your color quality control.


32 Responses
Your point of view caught my eye and was very interesting. Thanks. I have a question for you. https://www.binance.info/bn/register?ref=WTOZ531Y
Your article helped me a lot, is there any more related content? Thanks! https://accounts.binance.com/de-CH/register-person?ref=W0BCQMF1
Your article helped me a lot, is there any more related content? Thanks! https://accounts.binance.com/ar-BH/register-person?ref=S5H7X3LP
Your article helped me a lot, is there any more related content? Thanks!
Your article helped me a lot, is there any more related content? Thanks! https://www.binance.com/register?ref=IHJUI7TF
I don’t think the title of your article matches the content lol. Just kidding, mainly because I had some doubts after reading the article.
Your point of view caught my eye and was very interesting. Thanks. I have a question for you.
Thanks for sharing. I read many of your blog posts, cool, your blog is very good.
Thank you for your sharing. I am worried that I lack creative ideas. It is your article that makes me full of hope. Thank you. But, I have a question, can you help me?
Your article helped me a lot, is there any more related content? Thanks!
Can you be more specific about the content of your article? After reading it, I still have some doubts. Hope you can help me. https://accounts.binance.com/es-AR/register-person?ref=UT2YTZSU
Your article helped me a lot, is there any more related content? Thanks! https://accounts.binance.info/fr-AF/register?ref=JHQQKNKN
Thank you for your sharing. I am worried that I lack creative ideas. It is your article that makes me full of hope. Thank you. But, I have a question, can you help me?
Can you be more specific about the content of your article? After reading it, I still have some doubts. Hope you can help me.
Thanks for sharing. I read many of your blog posts, cool, your blog is very good.
Your article helped me a lot, is there any more related content? Thanks! https://www.binance.com/si-LK/register?ref=LBF8F65G
Your point of view caught my eye and was very interesting. Thanks. I have a question for you.
Your point of view caught my eye and was very interesting. Thanks. I have a question for you. https://accounts.binance.info/uk-UA/register-person?ref=XZNNWTW7
Thank you for your sharing. I am worried that I lack creative ideas. It is your article that makes me full of hope. Thank you. But, I have a question, can you help me? https://www.binance.info/en/register?ref=JHQQKNKN
Your article helped me a lot, is there any more related content? Thanks!
Thank you for your sharing. I am worried that I lack creative ideas. It is your article that makes me full of hope. Thank you. But, I have a question, can you help me? https://accounts.binance.info/de-CH/register?ref=W0BCQMF1
Your article helped me a lot, is there any more related content? Thanks!
Your point of view caught my eye and was very interesting. Thanks. I have a question for you. https://www.binance.com/register?ref=IHJUI7TF
Can you be more specific about the content of your article? After reading it, I still have some doubts. Hope you can help me. https://accounts.binance.info/id/register?ref=UM6SMJM3
Your point of view caught my eye and was very interesting. Thanks. I have a question for you. https://accounts.binance.info/register-person?ref=IHJUI7TF
Can you be more specific about the content of your article? After reading it, I still have some doubts. Hope you can help me.
Your point of view caught my eye and was very interesting. Thanks. I have a question for you.
Your point of view caught my eye and was very interesting. Thanks. I have a question for you.
Can you be more specific about the content of your article? After reading it, I still have some doubts. Hope you can help me.
Can you be more specific about the content of your article? After reading it, I still have some doubts. Hope you can help me.
Your article helped me a lot, is there any more related content? Thanks!
Your point of view caught my eye and was very interesting. Thanks. I have a question for you.