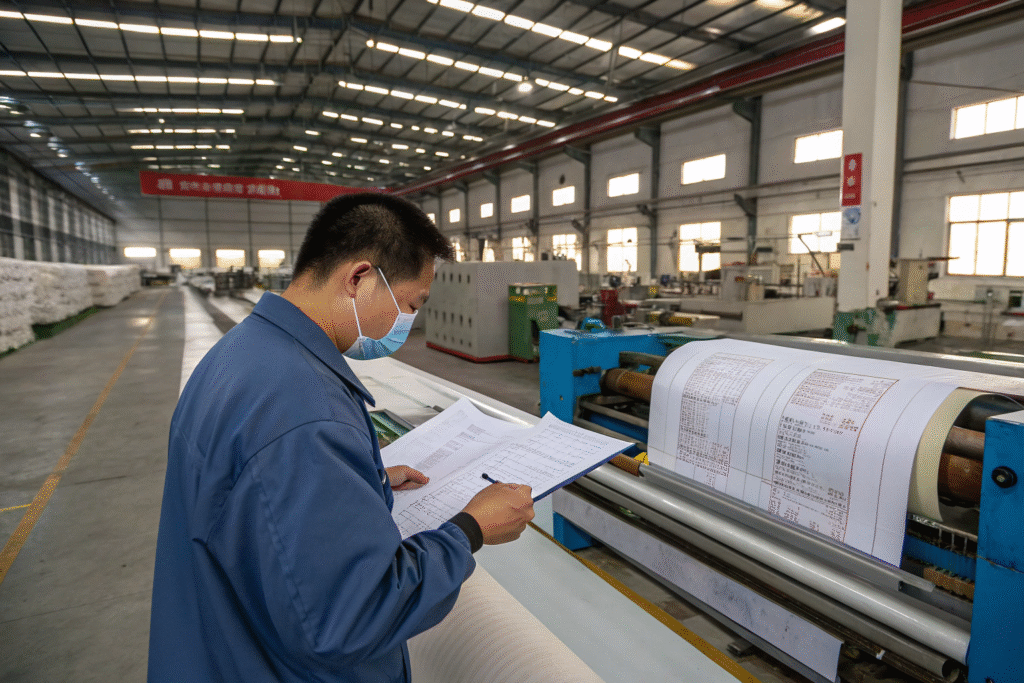
Watching customers struggle to verify your fabric quality claims or facing production delays because test certificates got lost in email chains? You're not alone. Most fabric suppliers still rely on paper trails and scattered digital files that create transparency gaps and erode customer trust. At Fumao, we've implemented a comprehensive QR code traceability system that has reduced quality disputes by 75% and cut administrative time by 40%—all while strengthening our brand reputation.
Building a traceable QR code system for fabric batches requires integrating physical labeling with digital data management, selecting the right technology stack, and establishing clear data governance protocols. The most effective systems connect raw material sourcing through production to final certification, creating an immutable digital thread that customers can access with a simple smartphone scan. Success depends on balancing technical complexity with user-friendly accessibility.
If you're tired of manual record-keeping and want to transform your fabric traceability from a compliance burden into a competitive advantage, here's how to build a system that actually works in real-world textile production.
What System Architecture Supports Effective Fabric Traceability?
The foundation of any successful QR code system is a robust architecture that can handle textile industry complexities. Unlike simple product tracking, fabric traceability must accommodate batch splitting, quality variations, and multiple testing stages. The most effective systems use a parent-child relationship structure where raw material batches become parent records that spawn multiple production child batches.
Your architecture needs four core components: a unique identifier system, a centralized database, a user-friendly interface, and secure access controls. The unique identifier should follow GS1 standards for global compatibility, incorporating company prefixes, product references, and serial numbers. The database must be cloud-based for accessibility but with robust security for sensitive test data. The interface should serve different information to different stakeholders—factory staff need production details while customers want simplified quality summaries.
How Should You Structure Your Data Hierarchy?
Effective data organization follows the fabric's journey through your supply chain. Start with raw material batches, then track through spinning, weaving, dyeing, finishing, and testing. Each stage should create a new data layer while maintaining connection to previous stages. The most practical approach uses this hierarchy:
- Level 1: Raw Material Origin (fiber source, certifications)
- Level 2: Production Process (spinning/weaving parameters)
- Level 3: Chemical Treatment (dye formulas, finishing chemicals)
- Level 4: Quality Testing (physical and chemical test results)
- Level 5: Final Certification (compliance documents, shipping data)
A Turkish textile mill reduced their customer quality complaints by 60% after implementing this structured approach, with each fabric roll QR code revealing exactly which production line, shift, and raw material batch created it.
What Database and Technology Stack Works Best?
The technology selection balances scalability, cost, and textile industry specific needs. We recommend cloud-based solutions like AWS or Google Cloud for their global accessibility and robust security. For small to medium operations, Microsoft Azure's IoT Hub provides excellent batch tracking capabilities. The database should use both SQL for structured data (test results, certifications) and NoSQL for unstructured data (production notes, image storage).
The most cost-effective stack we've implemented uses:
- Backend: Node.js or Python Django
- Database: PostgreSQL with JSON support
- QR Generation: QR Server or similar API
- Hosting: AWS EC2 or Google Cloud Compute
- Mobile Access: Responsive web design (no app required)
This stack handles 50,000+ monthly scans with 99.9% uptime at approximately $300 monthly hosting cost. Understanding QR code technology standards for supply chain ensures your system remains compatible with global logistics partners.
How to Design QR Codes That Survive Textile Production?
Fabric production environments are brutal on labels—chemical exposure, mechanical abrasion, heat, and moisture can destroy standard QR codes in hours. Designing durable labels requires selecting appropriate materials, protective coatings, and placement strategies that withstand your specific production conditions without compromising scan reliability.
The most durable QR codes for textile applications use synthetic materials like polyester or polyimide labels with industrial-grade adhesives. For fabrics undergoing harsh chemical processes, we recommend laser-etched QR codes directly onto fabric care labels or woven QR codes integrated into selvedge. The key is testing your chosen method against your most aggressive production stages—particularly dyeing, finishing, and washing processes.
Which Materials Withstand Different Production Environments?
Material selection depends on your specific production stages. For fabrics undergoing wet processing, synthetic paper labels with thermal transfer printing provide the best moisture resistance. For high-temperature processes like heat setting or curing, polyimide labels withstand temperatures up to 300°C. The table below shows optimal materials for common textile processes:
| Production Stage | Recommended Material | Printing Method | Special Considerations |
|---|---|---|---|
| Spinning/Weaving | Paper-based with laminate | Thermal transfer | Dust protection, mechanical abrasion |
| Dyeing/Finishing | Synthetic paper (Tyvek) | Resin ribbon | Chemical resistance, moisture proof |
| Heat Setting | Polyimide | Laser etching | Temperature resistance up to 300°C |
| Final Product | Woven label | Jacquard weaving | Softness, wash durability |
A Portuguese fabric manufacturer eliminated their label failure rate by switching to laser-etched QR codes on care labels, surviving their aggressive enzyme washing process that destroyed previous label generations.
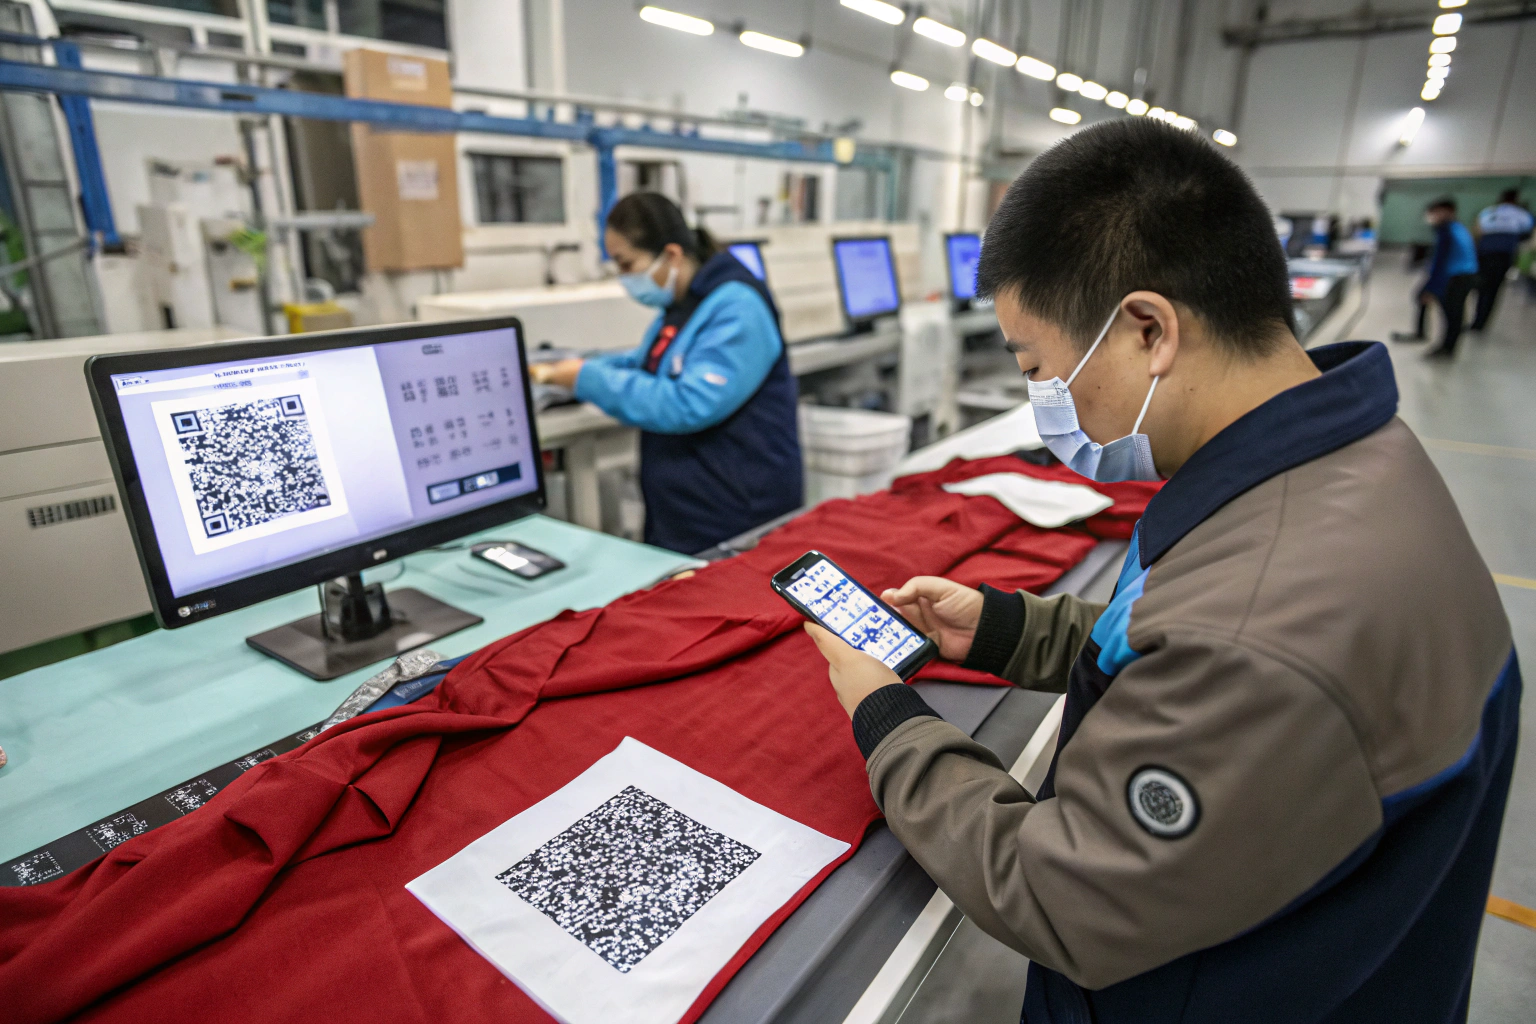
How to Ensure Consistent Scanning Reliability?
Scan reliability depends on contrast, size, error correction, and placement. The minimum QR code size for reliable smartphone scanning is 2x2 cm, but we recommend 3x3 cm for production environments. Error correction should be set to Level Q (25% recovery) or Level H (30% recovery) to withstand partial damage. Contrast is critical—black on white provides best results, but for dark fabrics, white QR codes on black backgrounds work well.
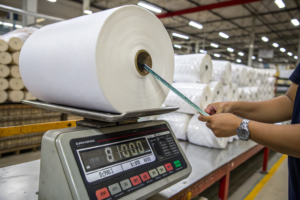
Placement strategy matters significantly. QR codes should be positioned where they're accessible but protected from direct abrasion. For fabric rolls, we place codes on the outer end of the core tube and replicate on the outer packaging. For finished fabrics, integrating QR codes into selvedge or care labels provides optimal protection. Regular validation testing with multiple smartphone models ensures consistent performance across different user devices.
What Data Should You Include at Each Production Stage?
The value of your traceability system depends entirely on what data you capture and how you present it. Overwhelming users with technical details causes frustration, while insufficient data undermines trust. The most effective systems provide layered information—simple summaries for quick verification with drill-down capabilities for technical users.
Each production stage should capture both process parameters and quality metrics. Raw material tracking includes fiber origin, lot numbers, and certification documents. Production stages record machine parameters, operator details, and timestamps. Testing phases document full results with laboratory accreditation details. The key is automating data capture where possible to minimize manual entry errors.
Which Quality Metrics Matter Most to Your Customers?
Customer information needs vary dramatically by segment. Fashion brands prioritize color consistency and compliance documentation, while technical textiles users need physical performance data. Our research shows these are the most frequently accessed data types:
- Compliance Documents: Oeko-Tex, REACH, bluesign® certificates
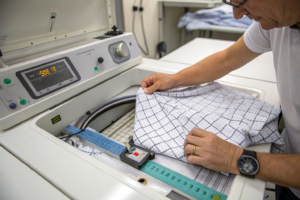
- Physical Tests: Tensile strength, tear resistance, pilling ratings
- Color Metrics: Delta E values, colorfastness ratings
- Composition Verification: Fiber content with tolerance ranges
- Production Timeline: Key process dates and duration
A German automotive supplier reduced their fabric qualification time by 70% by providing tiered access—their engineers saw full technical data while procurement staff accessed simplified compliance summaries.
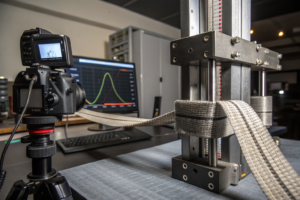
How to Automate Data Collection from Testing Equipment?
Automating test data collection eliminates transcription errors and saves significant time. Most modern testing equipment supports data export via USB, Ethernet, or API connections. For our CNAS-certified lab, we've connected Martindale abrasion testers, tensile strength machines, and color measurement devices directly to our traceability system via Python scripts that parse output files and populate the database automatically.
The implementation requires:
- Equipment Assessment: Identify data export capabilities
- Protocol Development: Create standardized data formats
- Integration Scripting: Develop import routines
- Validation Testing: Ensure data accuracy and completeness
This automation reduced our lab data entry time from 4 hours to 15 minutes daily while eliminating transcription errors that previously affected 3% of manual entries. Following laboratory data management best practices ensures your automated systems meet quality standards.
How to Implement Phased Roll-Out and Staff Training?
Attempting a full-scale traceability implementation across all products simultaneously almost guarantees failure. The most successful deployments follow a phased approach that starts with pilot products, incorporates staff feedback, and gradually expands functionality. This minimizes disruption while building organizational buy-in through demonstrated successes.
Begin with your simplest product line—typically basic woven fabrics with straightforward supply chains. Use this pilot to refine your processes, identify technical issues, and demonstrate tangible benefits. Then expand to more complex products, adding features like supplier portals, automated alerts, and advanced analytics. The entire implementation typically takes 3-6 months for basic functionality and 12-18 months for comprehensive coverage.
What Training Approach Ensures Staff Adoption?
Staff resistance represents the biggest implementation challenge. The key is demonstrating how the system makes jobs easier rather than creating additional work. We use a "show, don't tell" approach with hands-on workshops that highlight time-saving benefits. Production staff learn how quick scanning replaces manual record-keeping, while quality teams appreciate instant access to historical test data.
Our training methodology includes:
- Executive Briefings: Strategic benefits and ROI
- Supervisor Workshops: Process changes and team management
- Operator Hands-on Training: Daily scanning and issue reporting
- Administrator Technical Training: Data management and troubleshooting
A Chinese fabric mill achieved 95% staff adoption within two months by incorporating gamification—departments earned points for accurate scanning and complete data entry, with monthly rewards for top performers.
How to Manage the Transition from Legacy Systems?
Most companies have existing record-keeping systems that can't be abandoned immediately. The transition strategy should include parallel operation periods, data migration plans, and clear sunset timelines for old systems. We typically run legacy and new systems simultaneously for 4-8 weeks, gradually shifting priority to the QR system while maintaining legacy access for reference.
Data migration requires careful planning—some historical data should be transferred (certifications, supplier information) while other data can be archived (detailed production records beyond statutory requirements). The key is maintaining business continuity while transitioning to more efficient processes. A Spanish textile company completed their transition in 12 weeks by dedicating a cross-functional team to manage the parallel operation phase and address issues proactively.
What Are the Costs and ROI Expectations?
Implementing a comprehensive QR traceability system requires significant investment, but the returns typically justify the costs within 12-24 months. Costs include hardware (scanners, printers), software development, staff training, and ongoing maintenance. The business case should account for both tangible savings (reduced administrative time, fewer quality disputes) and intangible benefits (brand enhancement, customer loyalty).
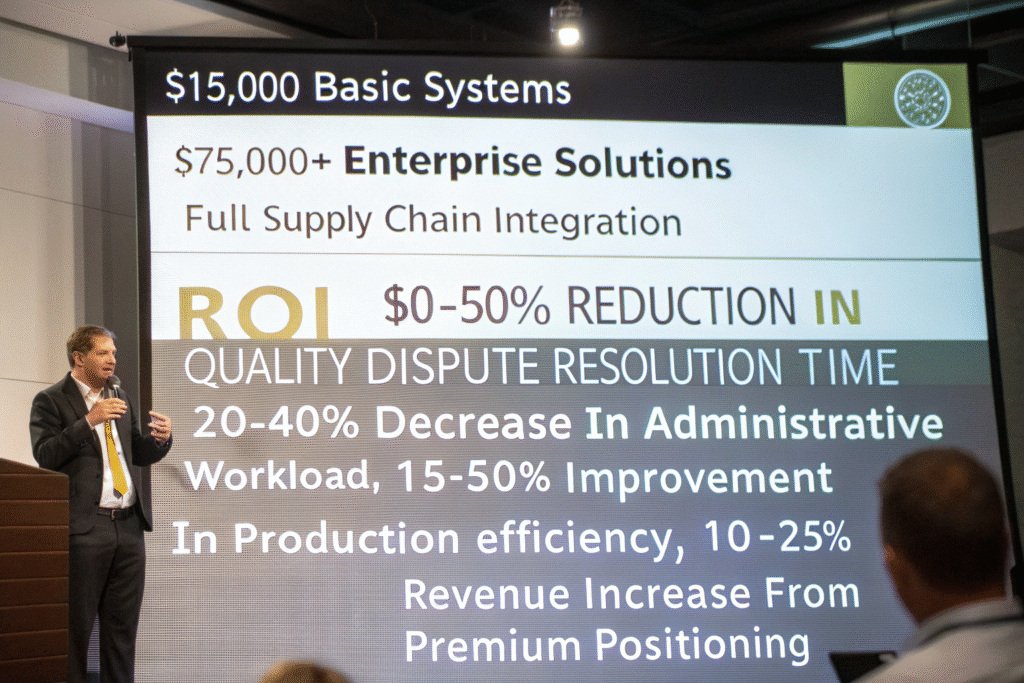
Our experience shows implementation costs ranging from $15,000 for basic systems to $75,000+ for enterprise solutions with full supply chain integration. The ROI typically comes from multiple areas: 30-50% reduction in quality dispute resolution time, 20-40% decrease in administrative workload, 15-30% improvement in production efficiency through better data visibility, and 10-25% revenue increase from premium positioning.
How to Calculate Your Specific Business Case?
Building a compelling business case requires quantifying both hard and soft benefits. Start by measuring your current costs in these areas:
- Quality Disputes: Staff time, replacement fabric costs, customer credits
- Administrative Work: Manual record-keeping, certificate generation, data searching
- Production Efficiency: Downtime from quality issues, rework costs
- Sales Impact: Lost opportunities from inability to verify claims
Then estimate potential improvements based on pilot results or industry benchmarks. Most companies achieve 40-70% reduction in quality dispute costs and 30-50% decrease in administrative time. The sales impact varies by market segment but typically ranges from 5-15% revenue growth for companies leveraging traceability as a marketing advantage.
What Ongoing Maintenance and Scaling Costs Should You Anticipate?
Beyond initial implementation, budget for ongoing costs including:
- Cloud Hosting: $200-800 monthly depending on data volume
- QR Code Generation: $50-200 monthly for label materials and printing
- System Updates: 15-20% of initial cost annually for enhancements
- Staff Training: Ongoing for new hires and feature updates
Scaling costs are typically linear—doubling your fabric volume approximately doubles hosting and material costs. However, the administrative savings scale super-linearly, as the system handles increased volume with minimal additional staff time. An Indian textile exporter achieved 320% production volume increase with only 15% administrative staff growth after implementing their QR traceability system.
Conclusion
Building a traceable QR code system for fabric batches transforms quality management from reactive firefighting to proactive value creation. The most successful implementations balance technical sophistication with practical usability, creating systems that staff actually use and customers genuinely value. While the initial investment is significant, the returns in reduced disputes, improved efficiency, and enhanced brand reputation typically deliver compelling ROI within the first year.
The key to success lies in starting simple, focusing on user experience, and progressively expanding functionality based on real-world feedback. Companies that treat traceability as a strategic initiative rather than a compliance requirement unlock the greatest value, turning transparency into competitive advantage. If you need guidance developing your traceability strategy or implementing a QR code system tailored to your specific operations, our technical team can provide comprehensive support based on extensive textile industry experience. For personalized advice and implementation support, contact our Business Director, Elaine, at elaine@fumaoclothing.com. Let us help you build a traceability system that strengthens customer trust while streamlining your operations.